Showing posts with label SQL Server. Show all posts

Friday, July 26, 2019

Connection Strings for VBA and MSOLEDB

They recently gave me a gig, which amongst setting up some databases included fixing up some spreadsheets to talk to the new database. This included fixing connection strings in VBA.

Background to the story the client wanted to move some systems from using Oracle DB as a back end to SQL Server as the data store.

Now two years ago I had never written from scratch a VBA script for Office Automation. It has now become a bit a skill set I have developed. I am not a fan of some of what I see. Not the code it’s good. More people have built a complete application using VBA and Excel. This is bad because it doesn’t deal well with governance. Potentially has security issues in that a username and password are available in the sheet,. Connection details including a host name are all potentially at risk.

On to the bit, you came to get. Many of you are aware Microsoft now endorsed OLEDB as the future. I am not going into the why, but it means you now have a new driver. We can find more info and the driver file from this page. Grab the driver and get it installed. Now the old OLE driver used the SQLOLEDB provider in connection strings long with the SQLNCLI driver are still deprecated. The new driver is using the MSOLEDBSQL Provider.

I needed to update stings, and I was needing to form the string based on limited information, connectionstrings.com wasn’t helping it’s not listed there as yet.  Noone else was showing details of a connection string to an Azure DB which was what I wanted to do.

I have access to the new VBA book “Microsoft Excel 2019 VBA and Macros, First Edition”, it disappointed me that the book didn’t show usage of the new driver, it has a copyright date of 2019 and they had released the driver in 2018

I will save you the hassle of finding this out for yourself. Here is the big reveal:


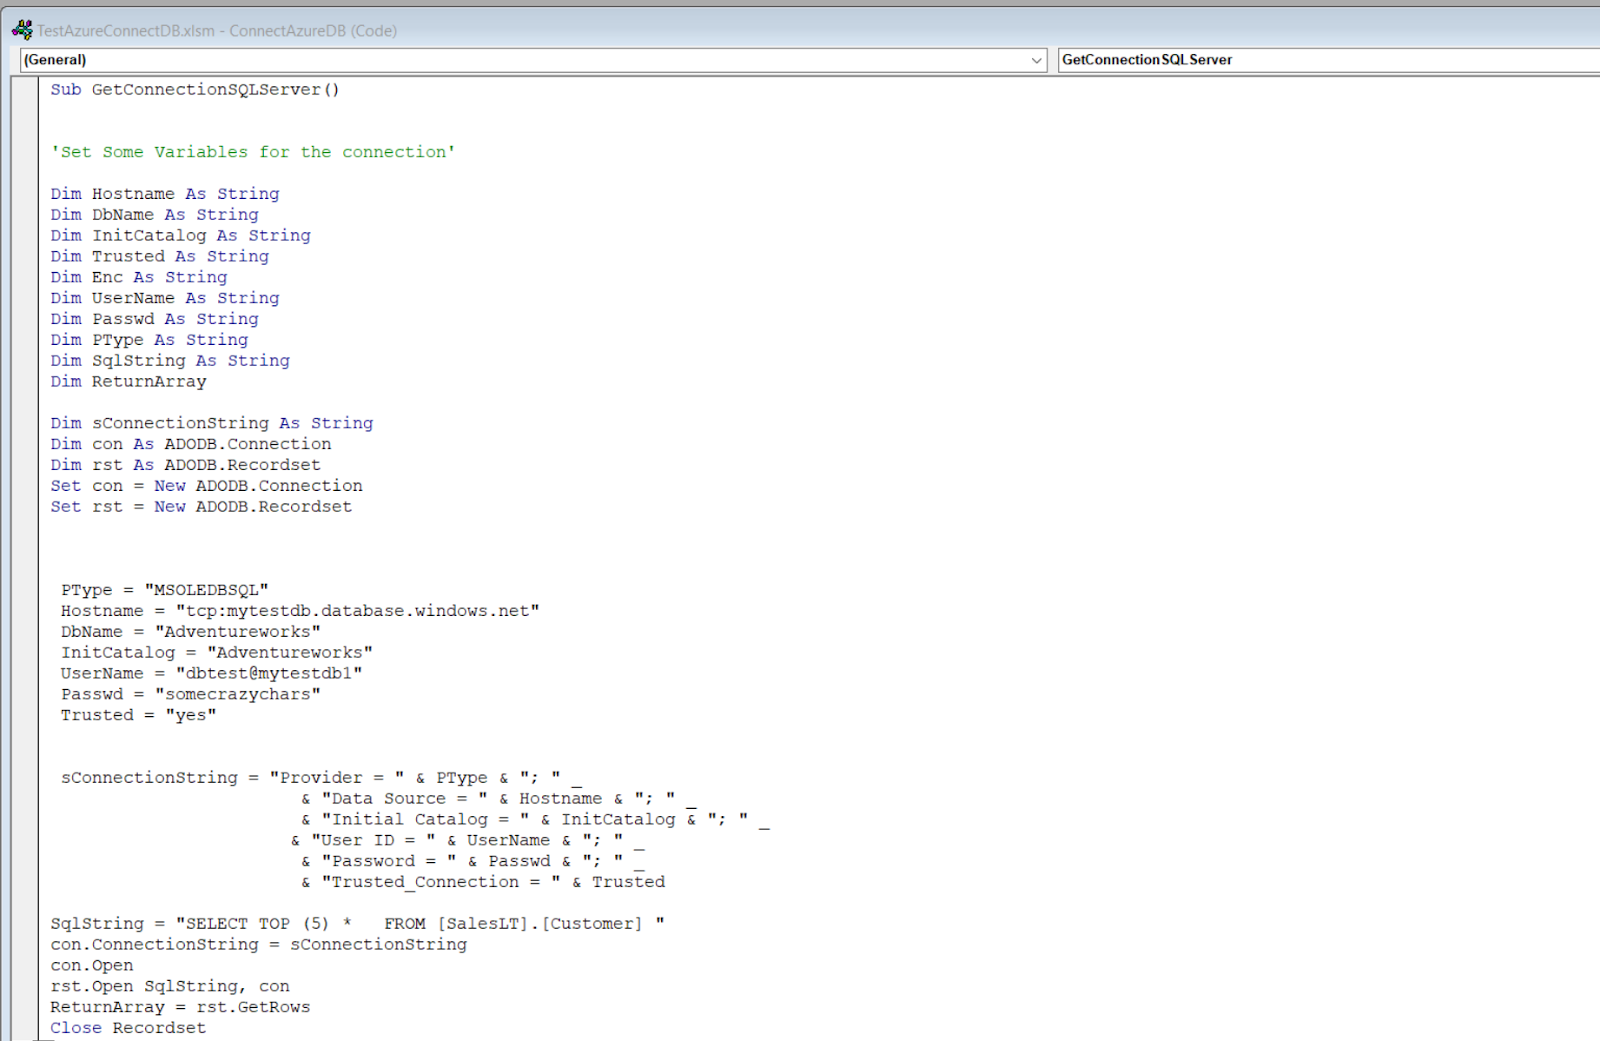
Dim UserName As String
Dim Passwd As String
Dim PType As String
Dim SqlString As String
Dim ReturnArray

Dim sConnectionString As String
Dim con As ADODB.Connection
Dim rst As ADODB.Recordset
Set con = New ADODB.Connection
Set rst = New ADODB.Recordset


 PType = "MSOLEDBSQL"
 Hostname = "tcp:mytestdb.database.windows.net"
 InitCatalog = "Adventureworks"
 UserName = "dbtest@myytestdb"
 Passwd = "somecrazychars" 
 Trusted = "yes"


 sConnectionString = "Provider = " & PType & "; " _
                        & "Data Source = " & Hostname & "; " _
                        & "Initial Catalog = " & InitCatalog & "; " _
                       & "User ID = " & UserName & "; " _
                        & "Password = " & Passwd & "; " _
                        & "Trusted_Connection = " & Trusted
                     
SqlString = "SELECT TOP (5) *   FROM [SalesLT].[Customer] "
con.ConnectionString = sConnectionString
con.Open
rst.Open SqlString, con
ReturnArray = rst.GetRows


Also, don't forget about the issues with non-alphanumreic chars. Check out the Strong Passwords


Ok, Enjoy.

See ya round

Peter

Saturday, July 07, 2018

SQL Server Buffer Cache Hit Ratio is dead

I was recently working with a  client on a problem they'd with an application. The client requested someone have a look over the database and see if I could find anything which the internal staff might have overlooked.

I started browsing around in the monitoring and noticed an anomaly. The database was showing an increase in IO Wait and nothing else. The monitoring tool hadn't alerted, though, in an advisor suggested to review IO Wait. Unfortunately, overlooking these measures was missing the problem. The general health of the database instance, CPU, memory, the number of connections etc were all rather benign. This along with a high BCHR and this lead people to come to the conclusion that the database server wasn't struggling and hence it was ok.

I've seen a quite a few articles in the SQL Server world dissing wait states and claiming BCHR as the tool of measures to DB health and yet here we're the exact thing Method R says pointed to an issue.

There's a great example over at SimpleTalk on how to show why BCHR isn't the greatest of measures. A database might be performing great work with only a BCHR of 65%. Individual circumstances will only tell you if that's right in a system. As the article at SimpleTalk discussed the idea that a system could be exhibiting memory pressure and yet still show a high BCHR.

When you search for Buffer Cache Hit Ratio tuning you'll find an article by Joe Chang and it, unfortunately, muddies the water on what reducing LIO was about. The thing is that Method R is about tuning out wait time and that it's highly applicable to modern SQL Server.

When you look at some of the graphs from the system you have Something that looked like this when the problem was in existence.

 What you can see here is a graph of various waits and the underlying area of IO wait in the blue.
This graph may not look that spectacular, nothing stands out, and that's why it might be easy to overlook. The balance was that the IO Wait was 30% and higher as a percentage of wait time. Other data was showing wait times of seconds. Now looking at the other measures of CPU, 20% to 40% random spikes in usage, nothing there. BCHR always above 90% and mostly above 99%. I then thought I'd overlooked something.

We investigated several potential slow queries identified due to logs of software using this database. Work found the need to fix one index. A few others went on the backlog for future work, but still no performance. I'd to come back to why was it getting such high IO. We'd optimised queries, we didn't have other performance issues, but we'd higher than seemed reasonable IO Wait time.

Next step was to get diskspd and run it on the drive where the data file was for the database. The results are below This server had dual 8GB HBA channels to the SAN. If you look down in the second section the total MB/s throughput is around 48MB/s possible half of a single 8GB channel. Also look at the 99th percentile. For those not quite up on their statistics, here I go. 1 out of 100 queries diskspd made was taking 32ms to read and 1 out 100 16 ms to write. Unlucky you if you got the 100th of both at the same time


Command Line: diskspd -b8K -d30 -o8 -t8 -h -r -w35 -L -Z1G -c50G G:\IOTest\iotestR1T1.dat

Input parameters:

timespan:   1
-------------
duration: 30s
warm up time: 5s
cool down time: 0s
measuring latency
random seed: 0
path: 'G:\IOTest\iotestR1T1.dat'
think time: 0ms
burst size: 0
software cache disabled
hardware write cache disabled, writethrough on
write buffer size: 1073741824
performing mix test (read/write ratio: 65/35)
block size: 8192
using random I/O (alignment: 8192)
number of outstanding I/O operations: 8
thread stride size: 0
threads per file: 8
using I/O Completion Ports
IO priority: normal


Results for timespan 1:
*******************************************************************************

actual test time: 30.00s
thread count: 8
proc count: 8

CPU |  Usage |  User  |  Kernel |  Idle
-------------------------------------------
   0|  19.66%|  13.99%|    5.67%|  80.34%
   1|  40.67%|  11.08%|   29.59%|  59.33%
   2|  19.71%|  11.86%|    7.85%|  80.29%
   3|  21.16%|  15.91%|    5.25%|  78.84%
   4|  25.33%|  17.42%|    7.90%|  74.67%
   5|  20.59%|  13.36%|    7.23%|  79.41%
   6|  22.36%|  14.04%|    8.32%|  77.64%
   7|  25.79%|  13.47%|   12.32%|  74.21%
-------------------------------------------
avg.|  24.41%|  13.89%|   10.52%|  75.59%

Total IO
thread |       bytes     |     I/Os     |    MiB/s   |  I/O per s |  AvgLat  | LatStdDev |  file
-----------------------------------------------------------------------------------------------------
     0 |       191004672 |        23316 |       6.07 |     777.18 |   10.291 |     6.838 | G:\IOTest\iotestR1T1.dat (50GiB)
     1 |       187531264 |        22892 |       5.96 |     763.05 |   10.480 |     8.466 | G:\IOTest\iotestR1T1.dat (50GiB)
     2 |       190963712 |        23311 |       6.07 |     777.01 |   10.293 |     6.858 | G:\IOTest\iotestR1T1.dat (50GiB)
     3 |       188301312 |        22986 |       5.99 |     766.18 |   10.438 |     8.153 | G:\IOTest\iotestR1T1.dat (50GiB)
     4 |       188792832 |        23046 |       6.00 |     768.18 |   10.410 |     7.029 | G:\IOTest\iotestR1T1.dat (50GiB)
     5 |       192118784 |        23452 |       6.11 |     781.71 |   10.232 |     6.327 | G:\IOTest\iotestR1T1.dat (50GiB)
     6 |       191086592 |        23326 |       6.07 |     777.51 |   10.284 |     6.488 | G:\IOTest\iotestR1T1.dat (50GiB)
     7 |       191832064 |        23417 |       6.10 |     780.55 |   10.246 |     6.587 | G:\IOTest\iotestR1T1.dat (50GiB)
-----------------------------------------------------------------------------------------------------
total:        1521631232 |       185746 |      48.37 |    6191.39 |   10.333 |     7.126

Read IO
thread |       bytes     |     I/Os     |    MiB/s   |  I/O per s |  AvgLat  | LatStdDev |  file
-----------------------------------------------------------------------------------------------------
     0 |       124010496 |        15138 |       3.94 |     504.59 |   11.605 |     7.852 | G:\IOTest\iotestR1T1.dat (50GiB)
     1 |       121675776 |        14853 |       3.87 |     495.09 |   11.788 |     9.912 | G:\IOTest\iotestR1T1.dat (50GiB)
     2 |       123576320 |        15085 |       3.93 |     502.82 |   11.627 |     7.880 | G:\IOTest\iotestR1T1.dat (50GiB)
     3 |       122241024 |        14922 |       3.89 |     497.39 |   11.773 |     9.524 | G:\IOTest\iotestR1T1.dat (50GiB)
     4 |       122519552 |        14956 |       3.89 |     498.52 |   11.778 |     8.101 | G:\IOTest\iotestR1T1.dat (50GiB)
     5 |       124936192 |        15251 |       3.97 |     508.35 |   11.538 |     7.227 | G:\IOTest\iotestR1T1.dat (50GiB)
     6 |       123412480 |        15065 |       3.92 |     502.15 |   11.619 |     7.431 | G:\IOTest\iotestR1T1.dat (50GiB)
     7 |       123387904 |        15062 |       3.92 |     502.05 |   11.590 |     7.604 | G:\IOTest\iotestR1T1.dat (50GiB)
-----------------------------------------------------------------------------------------------------
total:         985759744 |       120332 |      31.34 |    4010.97 |   11.664 |     8.237

Write IO
thread |       bytes     |     I/Os     |    MiB/s   |  I/O per s |  AvgLat  | LatStdDev |  file
-----------------------------------------------------------------------------------------------------
     0 |        66994176 |         8178 |       2.13 |     272.59 |    7.860 |     3.170 | G:\IOTest\iotestR1T1.dat (50GiB)
     1 |        65855488 |         8039 |       2.09 |     267.96 |    8.062 |     3.687 | G:\IOTest\iotestR1T1.dat (50GiB)
     2 |        67387392 |         8226 |       2.14 |     274.19 |    7.845 |     3.182 | G:\IOTest\iotestR1T1.dat (50GiB)
     3 |        66060288 |         8064 |       2.10 |     268.79 |    7.968 |     3.497 | G:\IOTest\iotestR1T1.dat (50GiB)
     4 |        66273280 |         8090 |       2.11 |     269.66 |    7.882 |     3.092 | G:\IOTest\iotestR1T1.dat (50GiB)
     5 |        67182592 |         8201 |       2.14 |     273.36 |    7.802 |     2.876 | G:\IOTest\iotestR1T1.dat (50GiB)
     6 |        67674112 |         8261 |       2.15 |     275.36 |    7.850 |     2.998 | G:\IOTest\iotestR1T1.dat (50GiB)
     7 |        68444160 |         8355 |       2.18 |     278.49 |    7.823 |     2.872 | G:\IOTest\iotestR1T1.dat (50GiB)
-----------------------------------------------------------------------------------------------------
total:         535871488 |        65414 |      17.03 |    2180.42 |    7.886 |     3.182


total:
  %-ile |  Read (ms) | Write (ms) | Total (ms)
----------------------------------------------
    min |      0.220 |      1.210 |      0.220
   25th |      5.568 |      5.910 |      5.742
   50th |      9.924 |      7.630 |      8.435
   75th |     16.694 |      9.396 |     13.386
   90th |     21.264 |     10.991 |     19.469
   95th |     24.205 |     12.038 |     22.507
   99th |     32.656 |     16.721 |     30.466
3-nines |     53.280 |     34.684 |     49.527
4-nines |    151.592 |     70.318 |    113.512
5-nines |    530.571 |    110.152 |    530.571
6-nines |    596.914 |    110.152 |    596.914
7-nines |    596.914 |    110.152 |    596.914
8-nines |    596.914 |    110.152 |    596.914
9-nines |    596.914 |    110.152 |    596.914
    max |    596.914 |    110.152 |    596.914

This led to further investigation by other people to find another database which had recently had a change made which showed it running at up to 798Mb/s over its port. These two databases shared a common port on some storage middleware above the disk servers for the SAN.

A couple of takeaways
  1. Assume nothing
  2. Test your theories
  3. Gather evidence
  4. Ask questions
  5. Challenge perceptions
End result the troubling database had its IO access moved to take it away from further interaction with the database which I'd been asked to investigate the performance slowness.
Another thing if you have slowness and you're trying to isolate the source it might take differently worded questions, "how is the database?" might not yield the answer you want. Perhaps try "What is happening in the database when an incident is happening and is that good or bad?"


Good luck with tuning

See ya round

Peter

Wednesday, January 03, 2018

Azure Internal Load Balancer Configuration - SQL Server Failover Cluster Instance on Azure Virtual Machines

I have just finished working with a colleague, resolving some issues with creating an IAAS SQL Server cluster in Azure. It took some trial and error and there are some real gaps in information, hopefully, this will help to fill one of them.

Let me first start by saying due to a lack of free diagnostics within Azure, you will need access to insights. This isn't something you would do with an MSDN subscription and might baulk at with your own paid for one.  Why not with MSDN, because with MSDN you can only use a minimal amount of Network Watcher resource and you require network watchers to do any diagnostics at the network level. I hope you have a friendly boss who will give you a space to do some learning and develop these needed Azure skills. alternatively,  or you have a bit of budget to do your own subscription and pay for resources. Make sure you have budget alerts to not blow out your costs and delete the Network watchers as soon as you have a working system.

We had to investigate the linkage between the Azure load balancer and the SQL Server Cluster and Network addresses on the SQL Server cluster. To see what was happening we needed App Insights and Network watchers.

What was the scenario

We had a SQL Server cluster without yet enabling Always on Services. We found that whilst we could connect to the node from which SQL Server was running we couldn't get a connection from any other server or system in our subnet, the problem was hidden as you cant do much to find out why what you are seeing is the problem and where it is.
We installed Wireshark, yes it is your best friend here and yes it is telling the truth even though it seems stupid it isn't seeing what you expected. We couldn't see any traffic when we tried the connecting to the cluster. We got the outbound packet to initiate a connection and then "crickets", nothing responding from the cluster or the load balancer.

Let's go back a step, one of the items in your list of tasks when doing this is to create the SQL cluster and then an internal load balancer.

Let me tell you the instructions on how to configure the internal load balancer in all the Microsoft documents and any blog posts I came across were terrible in the detail.

The load balancer requires Health Probe and that requires an active port on your individual nodes to validate their availability.

People have listed ports around 50k things like 52486 or 62159. Here is the missing bit it has to be an active service running on your server and it can't be anything to do with SQL Server, they are bound to the cluster and you are not able to access them via the individual node IP address

How do you work out a port, two things if you have a reason or don't overly care, you can install IIS and you will have port 80, however, try netstat -an and have a look, you will get entries like this
netstat -an listening ports
netstat - listening ports

 Proto  Local Address          Foreign Address        State
TCP    0.0.0.0:445            0.0.0.0:0              LISTENING
Use one of these ports for your backend service that is the ones near the start of the list and with the Local Address starting with 0.0.0.0, these are listening on all IP addresses on your system.

Once you configure the load balancer with this in the above section you will find your cluster SQL Server will become available to your other services in your Azure space. You will now be able to use SQL Server Management Studio to connect to the active node in the cluster on the cluster IP address


Saturday, July 01, 2017

SQL Server Linux - a quick look

After a few changes, I now have a SQL Server Linux installation running in a totally Linux environment.

Whilst there is still a dearth of tools for Linux-based SQL server it is very doable and manageable.
I have two choices of tools which I found to mostly be useful for managing SQL Server with no Windows present. It is going to be some time before we see if ever Management Studio on Linux so you are going to have to keep reviewing alternative tools with which to manage Linux with

The first is Microsoft official
sqlcmd

There are good instructions for all main distros to help you install sqlcmd and add the directory of the command files to your path.

Firstly install .Net Core to your Linux installation https://www.microsoft.com/net/core#linuxubuntu for the Ubuntu installation.

Next, install Microsoft Tools mssql-tools https://docs.microsoft.com/en-us/sql/linux/sql-server-linux-setup-tools#ubuntu.

once this is installed and right now if you are running 17.04 Ubuntu you will need to review the bug page for tools and install Preview versions as there are compatibility bugs which appear ironed out in those releases.


To access the data from some sort of GUI you might like Visual Studio Code as an editor which can interact with the SQL Server Database. You need to install the mssql extension.


The alternative I am using is DBDeaver http://dbeaver.jkiss.org/
It is based on Eclipse and seems rock solid as a database management tool. Now of course without all the proprietary bits of Management Studio your database T-SQL skills are going to have to raise a notch. You will need to grab the latest JDBC drivers from Microsoft https://docs.microsoft.com/en-us/sql/connect/jdbc/microsoft-jdbc-driver-for-sql-server


Now one final thing with VS Code is that it hasn't quite worked out Linux. Microsoft there is no C: lettering in file paths and the slashes in the path names need correcting, but I guess we can live with that for now.

DBBeaver file paths
VS Code file paths
 Overall it is great to see SQL Server advancing on Linux and I can see a lot of places using SQL Server Development Edition on Linux to eliminate a bundle of cost from their no production environments. It is a great step forward and look to the future when it goes full GA


See ya round

Peter